Among these tools, MS Excel is one of the tools that have really taken a central place in the current working environment. This is not just about counting but about presenting, categorizing, and analyzing data that can significantly improve decision-making. Excel is a tool for everyone, be you a student, analyst, or executive; having a good feel of the application hands you an advantage over your competitors.
In this Blog entry, we will discover why MS Excel is an essential tool in the business world. In this course, you’ll discover why understanding this application’s aspects is essential, starting with its background and progressing to how some of its features work and the functions it can perform. In this post, we’ll also suggest how it can be utilized and show some best practices to maximize its benefits (excuse the pun) in your work environment.

History of MS Excel
Microsoft Excel has been a major factor in changing how data is worked since its release in 1985. Originally designed for the Apple Macintosh computer, it proliferated, and by 1987, a Windows version appeared. Since then, the Excel program has been continually refined, and new elements have been incorporated in succeeding versions.
For many years, Excel has grown from a simple worksheet calculator to a sophisticated data analysis tool. Today, it’s integrated into Microsoft Office, and millions of people use it to analyze and display information.
Features of MS Excel
Here are some key features of MS Excel:
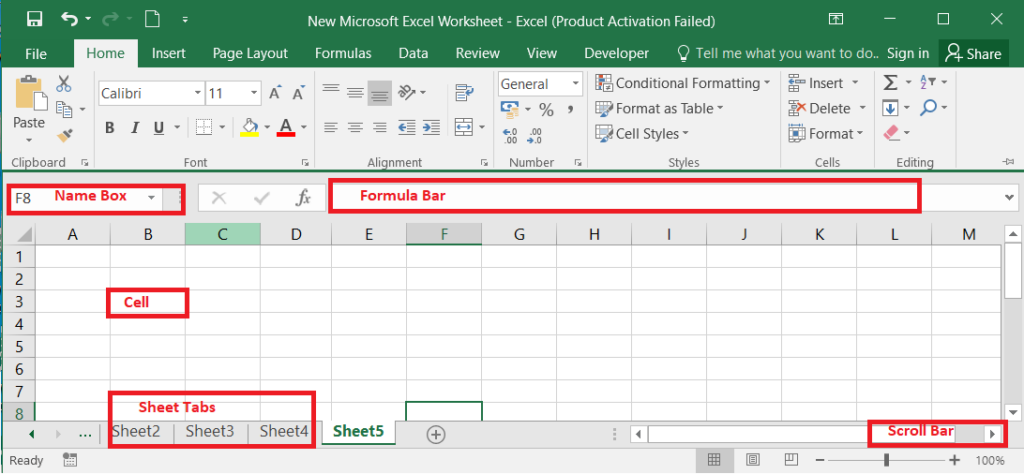
Spreadsheets and Cells
Fundamentally, Excel functions are based on spreadsheets and documents arranged in rows and columns. A cell results from the intersection of a row and a column; content is entered in cells. It offers logical data storage, making applying the different filters easier and arranging the collected information.
Formulas and Functions
Formula bars and functions are actually steps where Excel starts performing the actual calculations. A formula puts mathematical expressions from your cells, a function is a set of formula already programmed. For example, SUM() is a formula that adds all the numbers starting from a given range, while VLOOKUP() is a formula that searches for data in a drop-down list. These tools help to make calculations and analyses work, which are usually complicated.
Charts and Graphs
Data visualization is important here to enable fast comprehension of the data shown. Excel provides a host of charts ranging from the bar chart to the pie chart, depending on the sort of data analysis required. Further choices are available in each of these categories that permit you to design these visuals at your convenience flexibly.
Data Analysis Tools
Spreadsheeting is not just a question of data filing but data analysis. Some tools, such as Data Analysis Toolpak, come with an array of statistical functions that enable you to make logical decisions within the context of your data. Thus, proceeding deeper and using Sort, Filter, and Pivot Tables is possible.
How to Use MS Excel
Additional information on the basic tools and layout marks the initial move towards achieving better efficiency in using MS Excel. Here’s a detailed guide to help you get started:
- Open Excel: Open the Microsoft Excel application on the computer. When you begin, you can use an empty workbook or select from the many formats available.
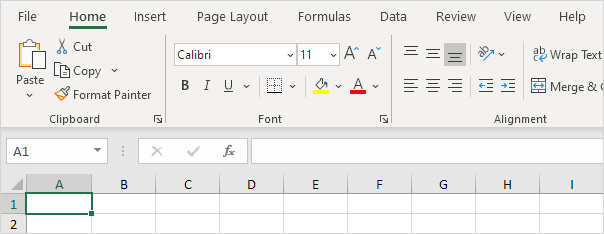
- Understand the Ribbon: This is the horizontal bar that lays along the top of the Excel window and holds tabs and commands – this bar is known as the Ribbon. Others are Home, Insert, Page Layout, Formulas, Data, Review, and View.
- Entering Data: It will highlight a cell you want to use, and as soon as you begin to type in the cell, it enters the data you want. To move down or across to another cell on the actsheet, use the “Enter” or “Tab” buttons.
- Formatting Cells: Resorting to the Home tab, you can change the font, size, color, or background of your cell. You can also align the numbers and the format for numbers here.
- Creating Formulas: First, use the alpha “Tab” key, then input “= ” in the cell, and then input the formula in the bar. For example, · · “=A1+B1” means that value in the cell A1 plus the value present in the cell B1 of the spreadsheet.
- Using Functions: Discover numerous possibilities in the ” Formulas ” tab. Numeric fields of the data should be managed efficiently with the help of functions like- SUM() for adding up the values, – AVERAGE() for averaging them, and – IF() when comparing the values.
- Inserting Charts: This ranges from selecting the data one wishes to present and then typing under the ‘Insert’ tab to look for a specific chart type that best suits the data type that one has selected and wishes to present.
- Sorting and Filtering: To do that, you need to apply certain features from the Data tab These features will allow you to comb large datasets with greater ease.
- Creating Pivot Tables: Choose your data, navigate to the “Insert” tab, and click “PivotTable” to manage and analyze your data in real time.
- Saving and Sharing: You should find a tab in the top left corner. Click on it, then select “File” to save your work. When you wish to share it, you can right-click on the spreadsheet or send it to a special folder accessible to the other party.
Therefore, when you master these basic tasks utilizing MS Excel, you will be well-positioned to exploit it for different uses in your personal and professional life.
Benefits of Using MS Excel
Improved Organization and Efficiency
Excel is essential to enhance the way you manage your information. Hazel sort and filter options allow for the organization of large amounts of data, and templates are convenient for the most common operations. They help to simplify affairs, thereby cutting out much handiwork and raising output.
Data Analysis and Visualization
Among all the Microsoft Office tools, Excel’s data analysis features make raw data ready to be used. This is the case as data can be well understood when presented as figures such as charts and graphs, which aid decision-making.
Collaboration and Sharing Capabilities
Excel has an object link feature, allowing documents to be shared with other users using OneDrive services. Co-author workbooks with others, work on the same document and see who made the changes. Excel helps to keep people on the same wavelength.
Integration to Microsoft Office
Expand the feature of data manipulation to Excel and integrate it with other Microsoft Office tools, for example, Word and PowerPoint, among others. Use a Spreadsheet to insert tables into the document or presentation, and vice versa. That way, all the related data is viewable in one place and can be updated easily across all sources.
Tips and Tricks for Using MS Excel
Here are some tips and tricks for Using MS Excel:
1. Master Keyboard Shortcuts
The quickest way for an Excel power user to work is by mastering keyboard shortcuts. Here are some essential ones:
- Ctrl + C: Copy the selected cells.
- Ctrl + V: Paste the copied content.
- Ctrl + Z: Undo the last action.
- Ctrl + Y: Course of action to be repeated If the action done was undone.
- Ctrl + S: Save your workbook.
- F2: Edit the active cell.
- Alt + =: Insert a SUM formula.
- Ctrl +: Insert the current date.
These are helpful in accelerating the work, propelling one away from the mouse, and making work in Excel more fluid.
2. Conditional Formatting
Conditional formatting enables or allows formatting that you want to be done on cells that satisfy or meet your set condition. For instance, one can transform the cells numerically greater than a certain threshold to green or frequently encode the variation of density of the data into density scales. To avail of this feature, one has to navigate to Home and select ‘Conditional Formatting.’ This tool also proves helpful when you want to quickly identify trends, patterns, or outliers in your data set.
3. Use Named Ranges
Naming ranges makes it easier to work with and eliminates mistakes when working with large data sheets. Rather than using the notation A1, you can use a name such as “Sales_Total.” This comes in handy, especially in large workbooks where the identification of the use of each cell or range is essential. To give a range a name, simply select and erase the ranges you don’t want to include, click on the Name Box, and enter the name you want to assign to the selected range. This goes hand in hand with reading and possibly with the upkeep of spreadsheets.
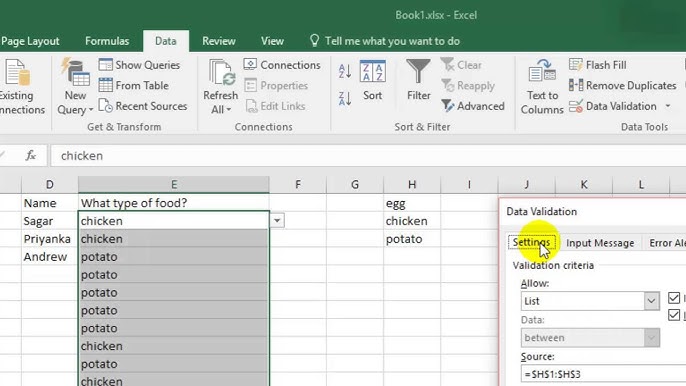
4. Learn more about the Data Validation Tool
Data validation is, therefore, a good method for data quality and uniformity. The idea here is that you have set standards, guidelines, or requirements and limit the input that can be entered into a cell, thus eliminating most mistakes. For example, you can enter a formula allowing a cell to contain only numbers between some or specific values. This tool can be obtained when you choose the Data tab and “Data Validation” and then choose the conditions you wish to apply.
It goes without saying that if such tricks and strategies are employed, one could achieve more work productivity and, at the same time, find applying Excel more enjoyable than a burden.