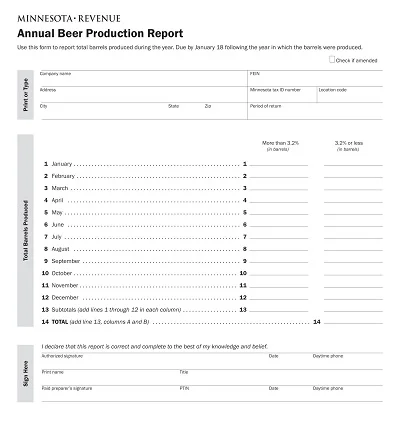
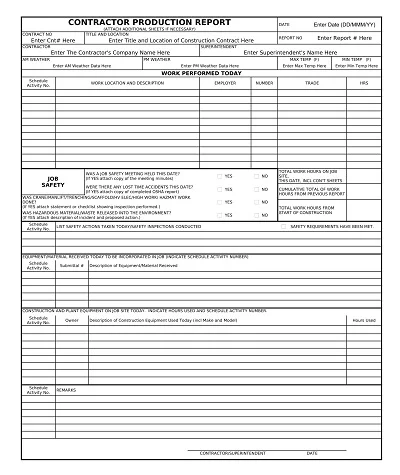
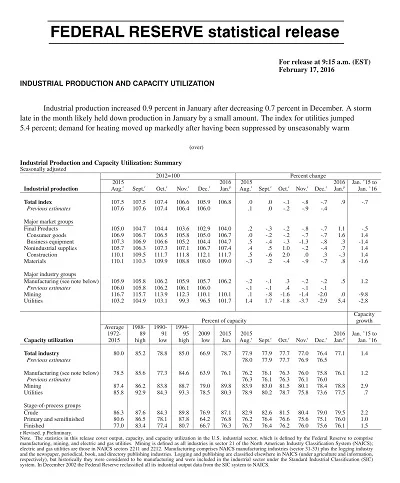
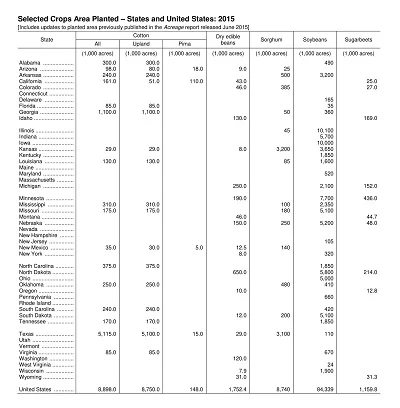
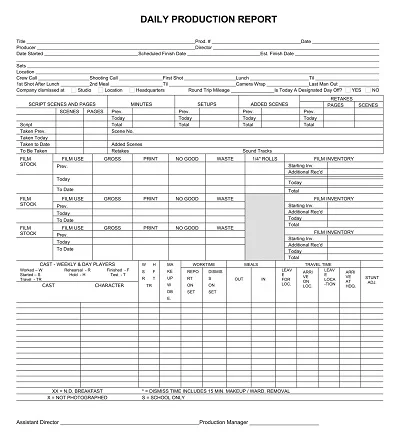
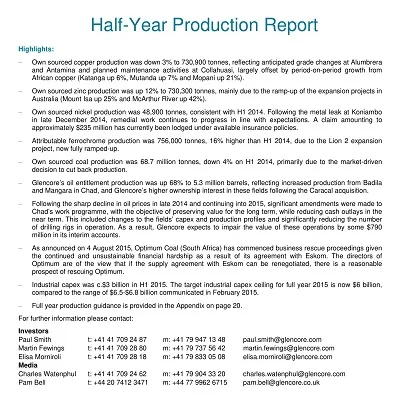
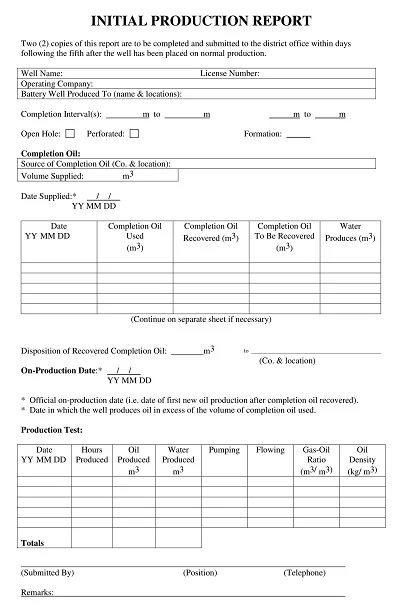
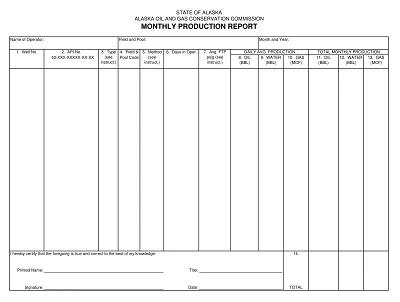
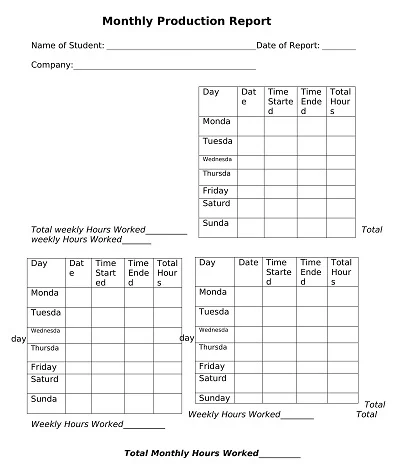
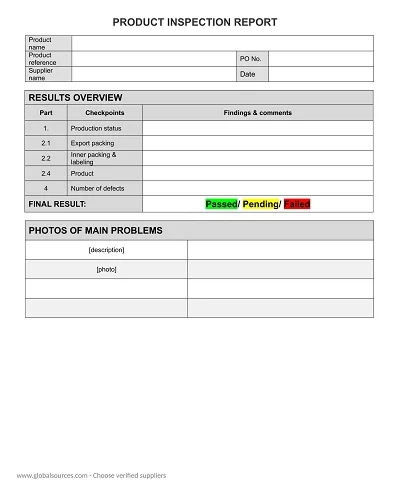
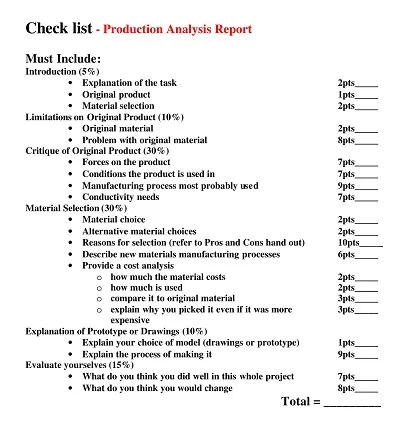
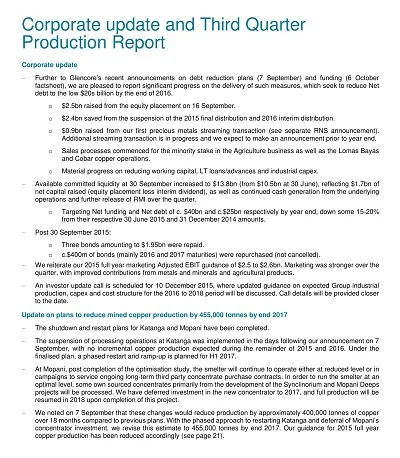
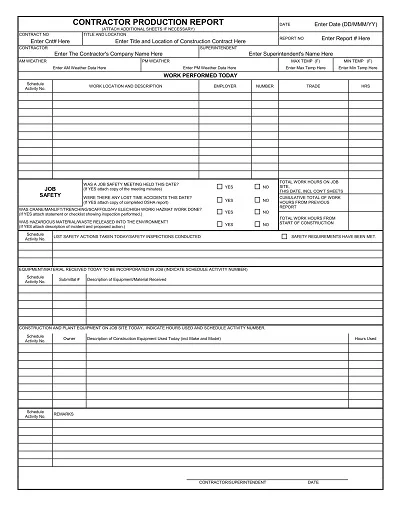
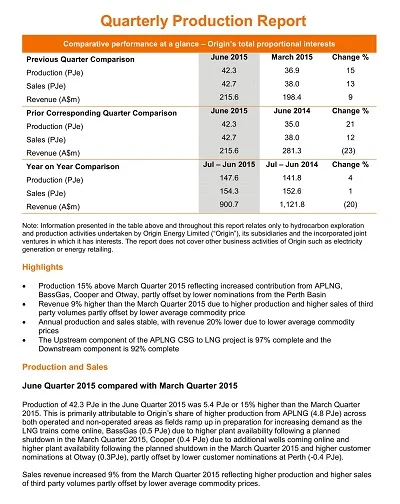
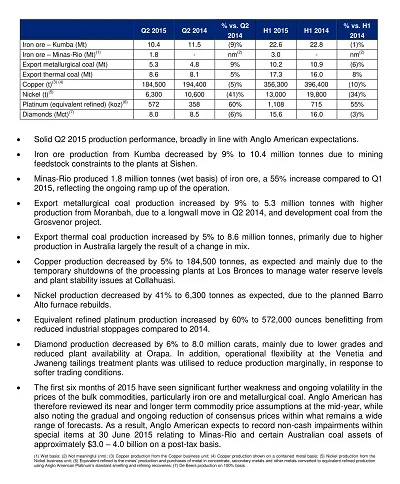
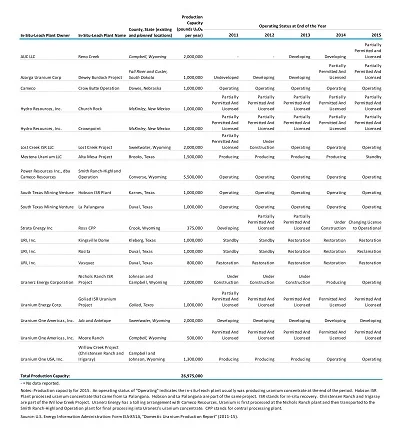
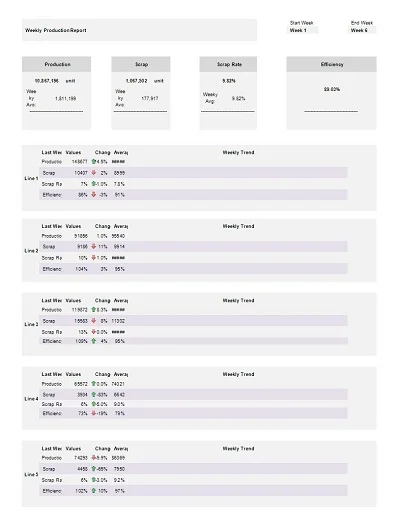
A Production Report Template can be defined as a template that gives the necessary instructions and format required for preparing a detailed production report in an organization. It records some essential aspects such as production rate and quantity, productivity, and time, which is a waste in the organization.
With these reports’ key elements of operation, most usually consisting of date, shift details, quantities produced, waste, and any comments about anomalies or problem areas, this type of standardized form can save valuable time and input. Using such a template makes it easier for the organization to plan on resource allocation to scale up operational performance. Stable consistency of the shop floor helps monitor its overall progress and regularly achieve the set output targets.
Download Free Production Report Templates
What is a Production Report?
Production reports are essential documentation in the manufacturing and production industry, enabling recording activities during a given time period. It contains important details on the amount of stock produced, the time taken, the equipment needed, and the employees used.
This record may focus on efficiency and productivity and help identify inefficiencies or possible complications in the process that affect the outcome, thus, helping the stakeholders navigate the process and optimize the results.
Types of Production Reports
Several manufacturing and service production reports are also prepared within the manufacturing and service production companies as performance tools to monitor productivity and resource utilization and enhance efficiency.
The primary reports include:
Capacity Utilization Report
Calculates the ratio between the output of a production capacity and the potential output to determine how well the capacities are being utilized.
Inventory Analysis Report
Gives specifics on stock management through inventories and information on other factors, such as the turnover rate, where problems like stock deficits or surpluses could be seen.
Waste Management Report
Registers and tracks the generation and disposal of waste during production, which can assist in accounting for all waste created and reveal possible means of minimizing these outputs and making the whole process less detrimental to the environment.
Energy Consumption Report
observes the energy use in different production structures, encourages efficient energy management to cut costs, and prevents negative environmental effects.
Employee Productivity Report
Examines the performance of each individual or team relative to production targets, encouraging the production of quality work in a constant process of enhancement.
Production Cost Report
Divides the total expenses in terms of its manufacturing aspects, namely its materials, costs of manpower, and other expenses, which provide information on its profitability and potential areas of cost reduction.
Benefits of using a Production Report Template
As we already pointed out, having a Production Report Template offers several benefits for businesses implementing this tool. First, using KPI templates in evaluating performance contributes to reporting conformity, meaning everyone in the company follows the same data collection and presentation formats. This comparability is useful when assessing performance trends or differences between business segments or time periods.
Furthermore, considering the generation of reports saves time and minimizes mistakes resulting from manual reporting. With the help of the provided template, managers will be able to gain deeper insight into the data concerned and make adequate decisions in response to the possible drawbacks noticed in terms of increasing productivity and profitability.
How to Create a Production Report Template
Proof of developing a production report template means placing certain key information and data essential for the production process at a producer’s disposal at a considerable distance in an orderly manner.
Here’s a step-by-step guide on how to create an effective production report template:
- Define the Purpose: The following immunohistochemistry aim and objective should be defined: Another question is what more do these stakeholders require regarding insights or information?
- Identify Key Metrics: Determine the key performance indicators (KPIs) and metrics relevant to your production process. Standard metrics include production volume, efficiency, downtime, defects, and quality.
- Choose a Reporting Tool: Choose the method for making the report. Alternatively, you can use Microsoft Excel, Google Sheets, or any other reporting tool designed for this purpose.
- Create a Header: Prepare the report with a header with the report’s title, the period being reported, and other pertinent information.
- Overview Section: When developing the chapter, one should start with the section titled ‘’Production performance overview’, which gives a glimpse of the evaluated results. High-level metrics and summaries mean that they put more emphasis on whole-picture evaluation than specific detail.
- Production Metrics Section: Set work exposure for processing and maintaining specific detailed production metrics. This may include:
- Production Volume: Units Produced by the Company Total As mentioned earlier, the number of final units produced by the company is the total unit output after all the interrelated processes have been completed.
- Efficiency Rate: The percentage produced by a particular company or an industry divided by the maximum it could make.
- Downtime: Periods of interruption where specific problems negatively impact the production process.
- Defect Rate: Defective percentages: This refers to the proportion of the total number of defective goods and services.
- Graphs and Visualizations: This way, you convert it to make sense by adding graphs, charts, or another form of visualization. Bar charts, line graphs, and pie charts are the most familiar charts commonly used for presenting information.
- Quality Control Section: If any, meta-data on the quality control measures for the work should be included in the proceedings:
- Inspection Results: Overall quality of products currently manufactured.
- Defect Types: Defects are classified into the following;
- Analysis and Insights: Allocates a section to analyze the data gathered and collected on the research study. Include strengths, challenges, and emerging patterns that one may pick up during the study.
- Recommendations: According to the analysis, state what changes should be implemented to improve the situation. Emphasize how changes could be made to address the problems detected.
- Conclusion: The report concludes that despite being affected by the baby bust and baby boom, the changing education system, the emergence of new technologies, and shifting demographics, universities continue to remain relevant and essentially crucial for society’s continued development. Place strong focus on the main messages to the shareholders and the summarized results in the reporting period.
- Appendix (Optional): To summarize, the formatting and structure of the paper should be as follows: Include an appendix for the additional data that might support the main content, the charts, or the detailed breakdowns.
- Review and Adjust: Fadechko should be reviewed and changed if necessary as the reporting requirements change and critical performance indicators evolve.
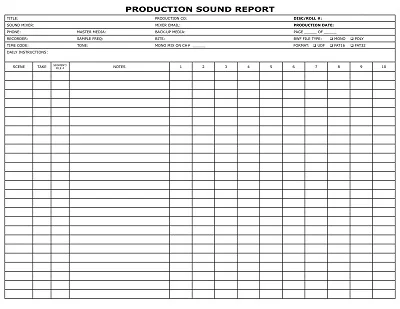
Production Report – [Month, Year]
Overview:
- Total Production Volume: [X units]
- Efficiency Rate: [X%]
- Downtime: [X hours]
- Defect Rate: [X%]
Production Metrics:
- Production Volume Trend (Chart)
- Efficiency Rate Trend (Chart)
- Downtime Analysis (Table)
- Defect Analysis (Table)
Quality Control:
- Inspection Results: [X% passed, X% failed]
- Defect Types: [Categorized]
Analysis and Insights:
- [Key observations and insights]
Recommendations:
- [Proposed actions for improvement]
Conclusion:
- [Summary of the production performance]
[Appendix: Additional data or detailed breakdowns]
Tips for using and updating the Production Report Template
When utilizing the Production Report Template, consider the following tips to maintain its efficacy:
- Stay Consistent: The table is read across columns and down, and to help record the changes made over time, the format for the update for each subsequent week should be the same as that reproduced here.
- Regular Updates: Don’t forget to provide the updates in the report more often, if possible, hourly, daily, weekly, or monthly, to ensure that the data they give you is updated.
- Data Verification: Regarding the issue of the accuracy of the figures being added to the report, it is important to practice checking and verifying the statistics on the report.
- Utilize Comments: Sometimes, it is helpful to make comments to understand the direction of the message when reading the report. When there is an odd sum or any note, it is essential to make comments that will help anyone reading the report understand the direction of the message.
- Review Trends: Sifting through a report as often as possible to find anything that can be repeated to assist decision-makers.
- Backup Your Data: One must take a copy of his/her report in case something happens to him/her or the material is lost since it contains essential information on findings.

